
BLOG: APPLIED RESEARCH OF EMMANUEL GOSPEL CENTER

The Value and Relevance of Community Research
In-depth research helps us go below the surface.
Photo credit: Andrew Holzschuh via Lightstock
The Value and Relevance of Community Research
By Rudy Mitchell, Senior Researcher
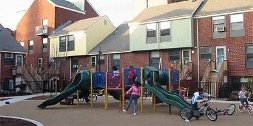
Why research our communities when we can simply talk to people or make casual observations?
In-depth research helps us go below the surface. There we discover the root causes of problems, hidden needs, or little-known assets and resources.
Research provides a broader understanding of the various trends or forces impacting our communities. With this greater awareness, Christians can more effectively minister in their communities or start new ministries.
Community research lays a foundation for community transformation and effective witness.
This presentation is part of the larger series, Community Research and the Church. For earlier segments, click here.


![Gender Based Violence & the Church [Resources]](https://images.squarespace-cdn.com/content/v1/57ff1c7ae58c62d6f84ba841/1525202179581-91N8RV6OP4ASQAHLX1OD/black-and-white-black-and-white-depressed-568025.jpg)


The Nature of Community Research
What is community research?
Photo credit: Sam Ramsey via Lightstock
The Nature of Community Research
by Rudy Mitchell, Senior Researcher
Communities are complex social systems made up of people interacting with each other within a local area. The geographical context can be as small as a neighborhood or as large as an entire region.
As we learned in the first part of the Community Research and the Church series, community research includes various tools to learn more about your neighbors and community.
Community research is the systematic, careful study of a group of people who have common ties and social interactions, as well as the local area in which they live or interact.
How does this square with our Christian faith? God’s revelation provides a perspective on the world that informs our study of communities and culture. This biblical and theological research combined with community research helps us apply biblical principles and develop practical ministries in the church and community.
This presentation is part of the larger series, Community Research and the Church. In the next segment, we explore the value and relevance of community research.

Ministry With Eyes Wide Open: The Varied Lenses of Community Research
From community-based participatory research to social-network analysis, there are various ways Christians can learn more about the communities they serve.
Photo credit: Hamilton Photography via Lightstock
Ministry with Eyes Wide Open: The Varied Lenses of Community Research
by Rudy Mitchell, Senior Researcher
Are you seeing all that can be observed about your community?
From community-based participatory research to social-network analysis, there are various ways Christians can learn more about the communities they serve.
In this presentation, we explore several approaches to community research:
Spiritual and religious assessment
Historical-research approach
Demographic approach with mapping
Community-based participatory research
Assets-based approach
Needs-assessment approach
Community-indicators approach
Leadership studies and stakeholder analysis
Case studies of organizations and best practices
Social-network approach
Systems-analysis approach
A number of these approaches can be used as part of an overall community-building or community-development process that leads to community transformation.
This presentation is part of the larger series, Community Research and the Church. In the next segment, we explore the nature of community research and how it relates to biblical research and Christian ministry.
Community Research and the Church
A Christian church or ministry functions in the context of a particular community. To effectively minister in that community, it’s important to understand it.
Photo Credit: Athena Grace via Lightstock
Community Research and the Church
by Rudy Mitchell, Senior Researcher
A Christian church or ministry functions in the context of a particular community. To effectively minister in that community, it’s important to understand it.
There are various ways Christians can learn more about the communities they serve. Community research provides us with the tools to go below surface observations. It lays a foundation for community transformation and effective witness.
In this series, we explore several facets of community research: different approaches, its nature, and its value and relevance to the church.
Illustrated Guide for Researching Your Community
From population trends to social needs, this illustrated guide lists the factors to consider when learning more about a local neighborhood or community.
Photo credit: Boston Heath via Lightstock
by Rudy Mitchell, Senior Researcher
Click here for a template of a community research guide.
Community or Neighborhood Name:
Community geography
Clearly identify the boundaries of your community (geographical, political).
Identify the U.S. Census tracts of the community (unless you are covering a large area) or identify other defined areas used in population or demographic surveys.
Describe the main geographical features of the neighborhood or community. Describe any other basic defining characteristics or features. What key features (rivers, hills, waterfront, railroad, etc.) influence or define the nature and boundaries of the community?
Create or obtain a detailed map of the neighborhood or community. Add boundaries and use the base map to add other items of interest such as churches, schools, social service organizations, landmarks, cultural organizations, neighborhood associations, recreational facilities, and other resource assets. Separate maps can be created for different types of resources or institutions. You can also do this using layers in digital maps. You can use Google My Maps to create and share online maps. See google.com/mymaps. Another online option is to create a map in Harvard World Map, worldmap.harvard.edu, or Open Street Map, openstreetmap.org.

Grove Hall Boundaries and Census Tracts

Map of neighborhood churches
Examples of maps in a community study.


Map of Organizations and Programs in a Neighborhood

Key to map
Maps of schools, churches, and other institutions can be created, or these can be combined using symbols into one map.

Hawthorne Grove, the Marshall P. Wilder Estate
Community history
Research the community’s history using primary and secondary sources, as well as oral history interviews. Aspects of community history may include biographical information on significant people; the history of the built environment; the history of religious and cultural organizations; economic and political history; and the history of ethnic, racial, and social changes. The history can be presented in narrative form supplemented with maps, charts, and visual illustrations.

Old Blake House, Edward Everett Square, Dorchester
Overall population and population trends
What is the current total population of the community or neighborhood?
What overall population trends have occurred in the last several decades? Include earlier data if available. Explore possible reasons related to the changes and possible future trends.
| Decade | 1990 | 2000 | 2010 | Latest |
|---|---|---|---|---|
| Total population | ||||
| % change from previous decade |
[The formula for the % change is (B-A) /A x 100. Say the 1980 population (A) is 1,000 and the 1990 population (B) is 800. To find the percentage change from 1980 (A) to 1990 (B), begin on the calculator with B (800) and subtract A (1,000), then divide that by A (1,000) and multiply it by 100. You should get -20. You can add the percentage sign (%) to -20. The percentage change from A (1,000) to B (800) is -20%.]

Example of a line graph showing the population trend for a neighborhood study.
Ethnic and racial composition and trends of the community
Fill out this table for the major ethnic and racial groups in the community. (You may expand the table if you would like to include more groups, or you may combine smaller groups into an “Other” category.) Separate tables can be created for each census tract or for specific nationalities within the Hispanic group. Graphs and maps may also be used to visualize trends and changes. If the community has other nationalities and ethnic groups not listed in your table, you can list and describe them separately. Describe any intercultural or inter-racial tensions that exist. Summarize your observations and analysis of population trends.
| Name of group (ethnic group, racial group etc.) | 2000 | 2010 | Latest | pop. of group | % of total pop. | pop. of group | % of total pop. | pop. of group | % of total pop. |
|---|---|---|---|---|---|---|
| 1. | ||||||
| 2. | ||||||
| 3. | ||||||
| 4. | ||||||
| 5. | ||||||
| Total pop. | 100% | 100% | 100% | |||
The formula to find the percent is A/total x 100. Say 2,000 people (total) are in your community, and 250 (A) are Hispanic. Put 250 (A) on your calculator, divide by 2,000 (total), and multiply by 100. You should get 12.5. You can add the percent sign to your answer because you multiplied by 100. 250/2,000 x 100 = 12.5% of the people in your community are Hispanic. (Make sure your percentages total 100%.)
From this table, how has the ethnic and racial composition of the community changed in the last few decades? Summarize your observations and analysis of population trends.
Describe any intercultural or inter-racial tensions that exist.
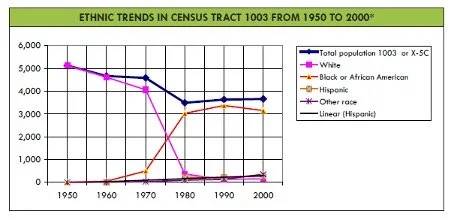
Example of a graph showing racial trends in a neighborhood.
Languages spoken and linguistic isolation
What languages are spoken in the community? Provide numbers per language.
What number and percentage of the population are linguistically isolated? ( A household is linguistically isolated if all members 14 years and older speak a non-English language and they speak English less than “very well.”) Of those who are linguistically isolated, what percentages speak various languages other than English? What percentage of the population over 5 years speaks English less than “very well?”

What are the age characteristics of the community’s population?
Complete the following table to reveal any important differences between the age profile of the church, community, and nation. Use your personal estimate or ask your pastor for the church data. (Figure the percentages and make sure they add up to 100.) Do the percentages differ significantly between the church, the community, and the nation?
| Age category | Your church | Community | Nation | Number | % | Number | % | Number | % |
|---|---|---|---|---|---|---|
| 0-4 years | ||||||
| 5-9 years | ||||||
| 10-19 years | ||||||
| 20-34 years | ||||||
| 35-64 years | ||||||
| 65+ years | ||||||
| Total | 100% | 100% | 100% | |||
The formula to find the percent is A/total x 100. Say there are 200 people (total) in your church, and 25 (A) are youth. Put 25 (A) on your calculator, divide by 200 (total), and multiply by 100. You should get 12.5. You can add the percent sign to your answer because you multiplied by 100. 25/200 x 100 = 12.5% of your church are youth.
What is the current median age of the population? Compare this with the median age of the nation, state, and larger city, or metropolitan area. Compare median age differences between different races in the community (and between the Hispanic and non-Hispanic populations).
Observe more specific characteristics of the teenage and young adult populations, such as the racial and ethnic composition. Break down the age groups by single years.
Which generations are represented in significant numbers in your church? Is one generation dominant?
Baby Boomers, born 1946-1964
Generation X, born 1965-1980
Millennials, born 1981-1996
Generation Z, born 1997-2012


Examples of graphs showing age profiles and comparisons of a neighborhood.
Family Characteristics and Marital Status
What is the average household size in the community? What is the average household size in the individual census tracts or subsections of the community? Observe any variations and also compare with the metropolitan area, state, and nation.
What are the numbers and percentages of the population (over 15 years) in your community who are:
| Marital status | Number | % |
|---|---|---|
| Now married (except separated) | ||
| Single (never married) | ||
| Separated | ||
| Divorced | ||
| Widowed | ||
| Total population (over 15 years) | 100% |
Source:
What percentage of families consist of (Compare to total population: A/total x 100 = %)
Married couples with children (under 18 years)? %
Married couples without children (under 18 years)? %
Households
What is the total number of households?
What percentage of households are family households?
What percentage of households are non-family households?
How do these percentages compare with the state and national percentages?
How many family households have children under 18 years?
How many of these family households with children under 18 are female-headed with no male spouse present?
How many of these family households with children under 18 are male-headed with no female spouse present?
What number and percentage of family households with children under 18 are single-parent households?
Number:
%:
What percentage of children under 18 years living in households, lived with
Grandparents:
Other relatives:
Non-relatives:
Economics and Income
Poverty
What percentage of the population is living below the poverty level?
What percentage of youth age 18 and under are living below the poverty level?
What percentage of youth ages 12-17 are living below the poverty level?
Families: What is the total number of families? What is the number of families living below the poverty level? What percentage of families live below the poverty level?
Comparisons: How do the percentages above compare with the city, state, and national percentages? Do some parts of the study area have higher rates of poverty than others?
Income
What is the median family income in this community?
What is the mean (average) family income in this community?
| 2000 | 2010 | Latest | |
|---|---|---|---|
| Community | |||
| Metropolitan area | |||
| State | |||
| Nation |
Trends
Has the general income of the community changed significantly relative to wider trends? (Middle income to lower income, or gentrification, etc.)
Employment
Major employers or types of employers in the community?
What is the present rate of unemployment? %
Have there been any changes in the type of employment, location of employment, or unemployment rates?
Education
Highest level of education: What percentage of all persons over 25 years old have
Less than high school?
High school?
Bachelor’s degree?
Master’s degree or higher
How do these percentages compare with the national and state percentages?

Example of a graph comparing educational achievements.
What is the current event drop-out rate for any high schools in the community?
Research the elementary and secondary educational institutions in the community.
List and describe each school. Provide any statistical data available.
List any postsecondary educational institutions and their enrollment.

Jeremiah Burke High School
Housing
What are the major housing types in the community based on your observation? (High-rise apartments or public housing; single-family detached houses, rowhouses, duplexes, triple-deckers, etc.)
What percentage of the housing units are owner-occupied? % (Compare to total)
What percentage of the housing units are low-income or affordable? % (Compare to total)
What is the median housing value for the community? For the nation?
Is the housing value increasing, decreasing, or stable?
What are the current typical monthly rental costs for a
Studio:
One-bedroom:
Two-bedroom:
Or more bedrooms
What housing needs and problems does the community have?

Recreation
List any important recreational facilities and activities in the community:
Source:
Community events
List major community events that occur annually or regularly:
Source:
Organizations
List any major community organizations, neighborhood associations, clubs, social, political, or educational groups:
Source:
Media
How are events in the community publicized?
Is there a community newspaper?
Source:
Social Needs
List any important Social Service Agencies and their services:
Source:
List three social needs that are not being effectively met by these groups.
Source:
What are the major crime concerns in the neighborhood?
Source:
Click here for a template of a community research guide.

Guide for Researching Your Community
From population trends to social needs, this guide lists the factors to consider when learning more about a local neighborhood or community.
Photo credit: JYount Photo via Lightstock
by Rudy Mitchell, Senior Researcher
Click here for an illustrated guide to researching your community.
Community or Neighborhood name:
Community geography
Clearly identify the boundaries of your community (geographical, political).
Identify the U.S. Census tracts of the community (unless you are covering a large area) or identify other defined areas used in population or demographic surveys.
Describe the main geographical features of the neighborhood or community. Describe any other basic defining characteristics or features. What key features (rivers, hills, waterfront, railroad, etc.) influence or define the nature and boundaries of the community?
Create or obtain a detailed map of the neighborhood or community. Add boundaries and use the base map to add other items of interest such as churches, schools, social service organizations, landmarks, cultural organizations, neighborhood associations, recreational facilities, and other resource assets. Separate maps can be created for different types of resources or institutions. You can also do this using layers in digital maps. You can use Google My Maps to create and share online maps. See google.com/mymaps. Another online option is to create a map in Harvard World Map, worldmap.harvard.edu, or Open Street Map, openstreetmap.org.
Community history
Research the community’s history using primary and secondary sources, as well as oral history interviews. Aspects of community history may include biographical information on significant people; the history of the built environment; the history of religious and cultural organizations; economic and political history; and the history of ethnic, racial, and social changes. The history can be presented in narrative form supplemented with maps, charts, and visual illustrations.
Overall population and population trends
What is the current total population of the community or neighborhood?
What overall population trends have occurred in the last several decades? Include earlier data if available. Explore possible reasons related to the changes and possible future trends.
| Decade | 1990 | 2000 | 2010 | Latest |
|---|---|---|---|---|
| Total population | ||||
| % change from previous decade |
[The formula to find the % change is (B-A) /A x 100. Say the 1980 population (A) is 1,000 and the 1990 population (B) is 800. To find the percentage change from 1980 (A) to 1990 (B), begin on the calculator with B (800) and subtract A (1,000), then divide that by A (1,000) and multiply by 100. You should get -20. You can add the percentage (%) sign to -20. The percentage change from A (1,000) to B (800) is -20%.]
Ethnic and Racial composition and trends of the community
Fill out this table for the major ethnic and racial groups in the community. (You may expand the table if you would like to include more groups, or you may combine smaller groups into an “Other” category.) Separate tables can be created for each census tract or for specific nationalities within the Hispanic group. Graphs and maps may also be used to visualize trends and changes. If the community has other nationalities and ethnic groups not listed in your table, you can list and describe them separately. Describe any intercultural or inter-racial tensions that exist. Summarize your observations and analysis of population trends.
| Name of group (ethnic group, racial group etc.) | 2000 | 2010 | Latest | pop. of group | % of total pop. | pop. of group | % of total pop. | pop. of group | % of total pop. |
|---|---|---|---|---|---|---|
| 1. | ||||||
| 2. | ||||||
| 3. | ||||||
| 4. | ||||||
| 5. | ||||||
| Total pop. | 100% | 100% | 100% | |||
The formula to find the percent is A/total x 100. Say there are 2,000 people (total) in your community, and 250 (A) are Hispanic. Put 250 (A) on your calculator, divide by 2,000 (total), and multiply by 100. You should get 12.5. You can add the percentage (%) sign to your answer because you multiplied by 100. 250/2,000 x 100 = 12.5% of the people in your community are Hispanic. (Make sure your percentages total 100%.)
From this table, how has the ethnic and racial composition of the community changed in the last few decades? Summarize your observations and analysis of population trends.
Describe any intercultural or inter-racial tensions that exist.
Languages spoken and linguistic isolation
What languages are spoken in the community? Provide numbers per language.
What number and percentage of the population are linguistically isolated? ( A household is linguistically isolated if all members 14 years and older speak a non-English language and they speak English less than “very well.”) Of those who are linguistically isolated, what percentages speak various languages other than English? What percentage of the population over 5 years speaks English less than “very well?”
What are the age characteristics of the community’s population?
Complete the following table to reveal any important differences between the age profile of the church, community, and nation. Use your personal estimate or ask your pastor for the church data. (Figure the percentages and make sure they add up to 100.) Do the percentages differ significantly between the church, the community, and the nation?
| Age category | Your church | Community | Nation | Number | % | Number | % | Number | % |
|---|---|---|---|---|---|---|
| 0-4 years | ||||||
| 5-9 years | ||||||
| 10-19 years | ||||||
| 20-34 years | ||||||
| 35-64 years | ||||||
| 65+ years | ||||||
| Total | 100% | 100% | 100% | |||
The formula to find the percent is A/total x 100. Say there are 200 people (total) in your church, and 25 (A) are youth. Put 25 (A) on your calculator, divide by 200 (total), and multiply by 100. You should get 12.5. You can add the percentage (%) sign to your answer because you multiplied by 100. 25/200 x 100 = 12.5% of your church is youth.
What is the current median age of the population? Compare this with the median age of the nation, state, and larger city, or metropolitan area. Compare median age differences between different races in the community (and between the Hispanic and non-Hispanic populations).
Observe more specific characteristics of the teenage and young adult populations, such as the racial and ethnic composition. Break down the age groups by single years.
Which generations are represented in significant numbers in your church? Is one generation dominant?
Baby Boomers, born 1946-1964
Generation X, born 1965-1980
Millennials, born 1981-1996
Generation Z, born 1997-2012
Family Characteristics and Marital Status
What is the average household size in the community? What is the average household size in the individual census tracts or subsections of the community? Observe any variations and also compare with the metropolitan area, state, and nation.
What are the numbers and percentages of the population (over 15 years) in your community who are:
| Marital status | Number | % |
|---|---|---|
| Now married (except separated) | ||
| Single (never married) | ||
| Separated | ||
| Divorced | ||
| Widowed | ||
| Total population (over 15 years) | 100% |
Source:
What percentage of families consist of (Compare to total population: A/total x 100 = %)
Married couples with children (under 18 years)? %
Married couples without children (under 18 years)? %
Households
What is the total number of households?
What percentage of households are family households?
What percentage of households are non-family households?
How do these percentages compare with the state and national percentages?
How many family households have children under 18 years?
How many of these family households with children under 18 are female-headed with no male spouse present?
How many of these family households with children under 18 are male-headed with no female spouse present?
What number and percentage of family households with children under 18 are single-parent households?
Number:
%:
What percentage of children under 18 years living in households, lived with
Grandparents:
Other relatives:
Non-relatives:
Economics and income
Poverty
What percentage of the population is living below the poverty level?
What percentage of youth age 18 and under are living below the poverty level?
What percentage of youth ages 12-17 are living below the poverty level?
Families: What is the total number of families? What is the number of families living below the poverty level? What percentage of families live below the poverty level?
Comparisons: How do the percentages above compare with the city, state, and national percentages? Do some parts of the study area have higher rates of poverty than others?
Income
What is the median family income in this community?
What is the mean (average) family income in this community?
| 2000 | 2010 | Latest | |
|---|---|---|---|
| Community | |||
| Metropolitan area | |||
| State | |||
| Nation |
Trends
Has the general income of the community changed significantly relative to wider trends? (Middle income to lower income, or gentrification, etc.)
Employment
Major employers or types of employers in the community?
What is the present rate of unemployment? %
Have there been any changes in the type of employment, location of employment, or unemployment rates?
Education
Highest level of education: What percentage of all persons over 25 years old have
Less than high school?
High school?
Bachelor’s degree?
Master’s degree or higher
How do these percentages compare with the national and state percentages?
What is the current event drop-out rate for any high schools in the community?
Research the elementary and secondary educational institutions in the community.
List and describe each school. Provide any statistical data available.
List any postsecondary educational institutions and their enrollment.
Housing
What are the major housing types in the community based on your observation? (High-rise apartments or public housing; single-family detached houses, rowhouses, duplexes, triple-deckers, etc.)
What percentage of the housing units are owner-occupied? % (Compare to total)
What percentage of the housing units are low-income or affordable? % (Compare to total)
What is the median housing value for the community? For the nation?
Is the housing value increasing, decreasing, or stable?
What are the current typical monthly rental costs for a
Studio:
One-bedroom:
Two-bedroom:
Or more bedrooms
What housing needs and problems does the community have?
Recreation
List any important recreational facilities and activities in the community:
Source:
Community events
List major community events that occur annually or regularly:
Source:
Organizations
List any major community organizations, neighborhood associations, clubs, social, political, or educational groups:
Source:
Media
How are events in the community publicized?
Is there a community newspaper?
Source:
Social Needs
List any important Social Service Agencies and their services:
Source:
List three social needs that are not being effectively met by these groups:
Source:
What are the major crime concerns in the neighborhood?
Source:
Click here for an illustrated guide to researching your community.

Starter Resources on Race for White Evangelicals
You're White, and you want to engage responsibly and respectfully on race issues. You're an evangelical, and you believe the ministry of reconciliation is part of your calling as a follower of Jesus. Where do you begin? Check out these starter resources recommended by Megan Lietz, a White evangelical committed to helping other White evangelicals on their race journey.
Starter Resources on Race for White Evangelicals
by Megan Lietz
Biblical and Theological Foundations
As with all matters, it’s important that we root our understanding in God’s word. Explore the following resources to better understand the biblical and theological foundation of continuing God’s redemptive work across racial lines.

A Theology of Racial Healing: Though the word “racism” is not used in the Bible, scripture tells the story of God reconciling all people to himself and one another. In this resource, RCCI suggests a Biblically-grounded theology on Christ's redemptive work in the area of race relations.

The Sin of Racism: Though racism is often not named as a sin from the White evangelical pulpit, this article by Tim Keller explains from a biblical perspective how racism is a sin and that it manifests individually and corporately. Though there is disagreement around how to respond to racism, as Christians, we cannot leave this sin unaddressed.

Ethnic Identity: Bringing Your Full Self to God: God gave each one of us ethnic identities that reflect the character and image of God. Explore what the Bible has to say about ethnicity and culture in this self-led Bible study for groups and individuals. It reveals how God sees our ethnic identity and uses it as a part of his redemptive plan.
Race & Racial Hierarchy as the Product of Broken Humanity
While our ethnicities were given to us by God, the social classification of race and the racial hierarchy it serves was a product of a broken humanity. To learn more about how the concept of race developed and was shaped by socio-historical realities, not God’s will, explore the following resources.

Race: The Power of Illusion: This is a three-part PBS documentary that explores the origins of race and how it is not a genetic reality, but a relatively new social construct. Though somewhat dated, the foundation laid here is important to understanding the concept of race. If only one episode is watched, it is recommended to watch Part 2: The Story We Tell. It can be rented on vimeo or is available via Kanopy subscription service, that may be available through a local library.
Our Experience and Identity as White People
In order to engage effectively as white people in issues of race we need to understand how our experiences and perspectives may be different from those of people of color. An important part of this is understanding the racial privilege and power we have as White people because of the color of our skin. For some perspective, check out the following resources.

If you’re looking for a primer on how aspects of our identity like race and gender grant us measures of privilege and how they can impact our lived experience check out Allan Johnson’s book, Privilege, Power, and Difference.

Waking Up White is a memoir by Debby Irving, a white woman who grew up in a predominantly white, wealthy suburb of Boston, about how she came to see and respond to her whiteness. Her journey can offer insights and encouragement for your own.

In, White Awake: An Honest Look at White It Means to Be White, Daniel Hill leads readers through phases of White identity development and offers biblical tools to navigate these seasons of growth. He also offers strong chapters on markers of racial awareness and action steps you can take to progress in your racial awareness journey.
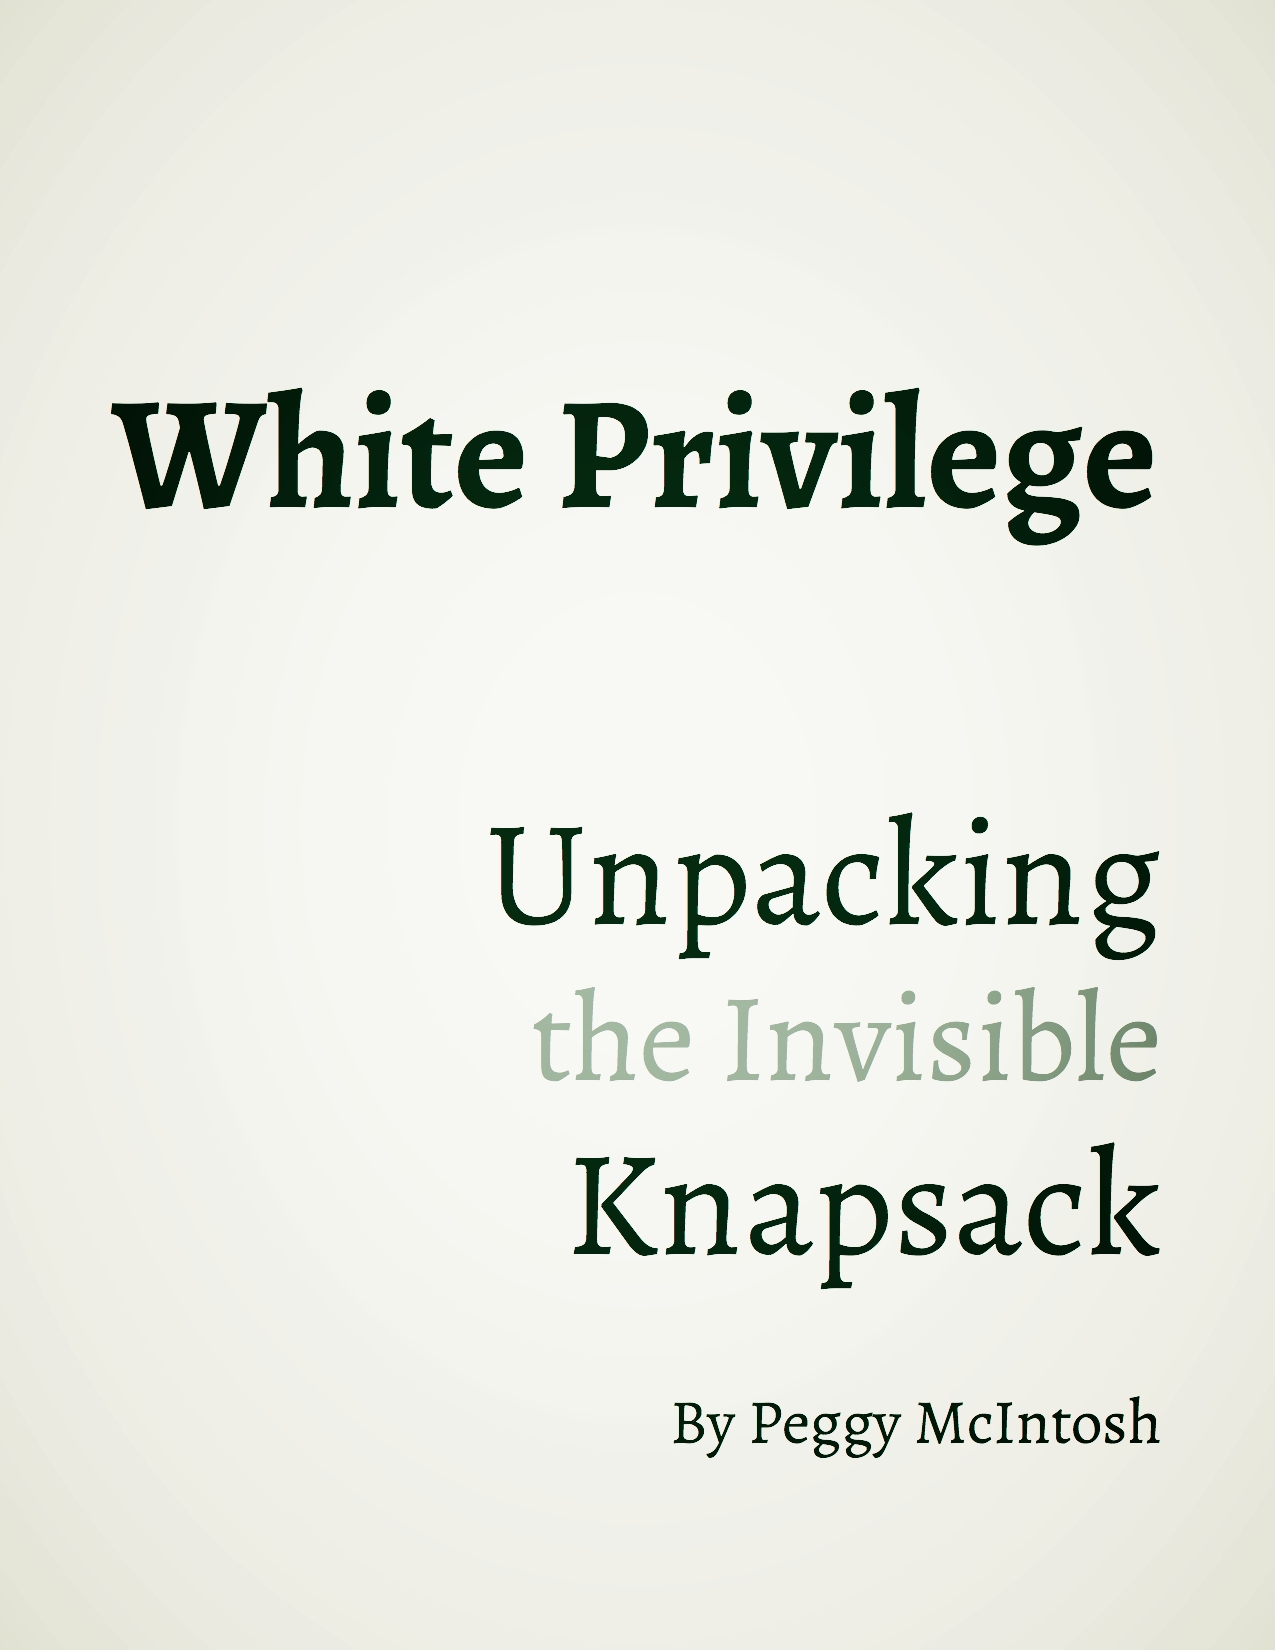
Peggy McIntosh’s article, White Privilege: Unpacking the Invisible Knapsack, is a brief and classic work that gives examples of how white people may experience privilege in their daily life. Simply becoming aware of what privilege looks like and how it can manifest in our lives is a crucial step!
Engaging Issues of Race
As we explore our identity as white people, we need to consider how this shapes our role in engaging issues of race and develop a toolkit for effective action.

Woke Church, by Eric Mason, explores the biblical call to justice that is for all believers and how the Church can regain its prophetic voice and practice to confront racism in the United States.

How to Be Last: A Practical Theology for Privileged People is a blog post by Christena Cleveland that lays a theological foundation for the posture that white people should take as they follow people of color into the work of racial reconciliation.
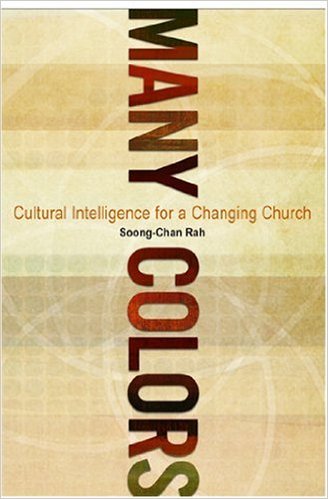
Soong Chan Rah’s book, Many Colors: Cultural Intelligence for a Changing Church, explores what Christians need to know and do to engage across racial lines in ways that are loving and respectful.
Mark Kramer’s article, Unpacking White Privilege: Feeling Guilty about Racial Injustice Isn’t the Point; the Point Is Doing Something About It complements Peggy’s McIntosh’s article by offering suggestions for how to respond to some of the privileges she identifies.
For additional resources, check out Next Step Resources for White Evangelicals.
Take ACTION
Megan Lietz, M.Div., STM, helps White evangelicals engage respectfully and responsible with issues of race. She is the director of EGC’s Race & Christian Community Initiative.


RESEARCHING YOUR CITY FOR MINISTRY IMPACT
Resource List used by Nika Elugardo for Movement Day 2016.
Resources for Research
PRESENTER’S WEB CONNECTIONS
· Berlin – Gemeinsam für Berlin (Together for Berlin) http://www.gfberlin.de/startseite
· Boston – Emmanuel Gospel Center (EGC) – http://www.egc.org/
· South Africa –
o Jewels of Hope http://jewelsofhope.org/
o Johannesburg Housing Company – http://www.jhc.co.za/
EXAMPLES OF RESEARCH FROM EMMANUEL GOSPEL CENTER (EGC)
Note: EGC is engaged in a website makeover. We are working to migrate files from our old site to the new one as quickly as we can. Some of these resources may not be available right away.
· New England’s Book of Acts. Stories of how God is growing the churches among many people groups and ethnic groups in Greater Boston. https://www.egc.org/blog-2/new-englands-book-of-acts.
· What is the Quiet Revival? an overview:
What is the Quiet Revival? Fifty years ago, a church planting movement quietly took root in Boston. Since then, the number of churches within the city limits of Boston has nearly doubled.
http://www.egc.org/blog/2016/10/13/understanding-bostons-quiet-revival
· Youth Violence System Project (YVSP) – http://www.gettingtotheroots.org/
o YVSP Neighborhood Studies — http://www.gettingtotheroots.org/community
o YVSP overview — Khary Bridgewater, et al, “A Community-Based Systems Learning Approach to Understanding Youth Violence in Boston,” Progress in Community Health Partnership: Research, Education, and Action) http://www.gettingtotheroots.org/aes/sites/default/files/yvsp_sprev_article1.pdf
· Boston Church Directory — print editions 1989 to 2001; online condensed edition at http://egcboston.force.com/bcd
Other EGC studies (some available in print, all will be available online in the near future at egc.org)
· The Unsolved Leadership Challenge (2014; church planting and women in leadership)
· Christianity in Boston (1993; discovery of Quiet Revival)
· Educating Urban Christians in the 21st Century (1998; needs assessment study)
· Youth Ministry in Boston (1995; needs assessment survey)
· Studying Urban Communities (1994, and updates; questionnaire and study guide)
SOME EXCELLENT CITY RESEARCH TOOLS & ORGANIZATIONS
Center for the Study of Global Christianity: (Gordon-Conwell Theological Seminary) does research to maintain the World Christian Database, which has data on over 5,000 cities. It also is the repository for research collected by the World Evangelisation Research Center in Nairobi, Kenya. Other resources include the World Christian Encyclopedia and the Atlas of Global Christianity. Director Todd Johnson. http://www.gordonconwell.edu/ockenga/research/index.cfm
Community Tool Box: a major, free online set of resources for anyone seeking to improve communities or foster social change. Among the 46 areas covered in English, Spanish and Arabic are several related to research: “Assessing Community Needs and Resources” (Ch. 3), Evaluation Research (Chs. 36-39), and “Analyzing Community Problems and Solutions” (Ch. 17). Associated with the Univ. of Kansas. http://ctb.ku.edu/en/table-of-contents
Global Research, International Mission Board (IMB) & Global Research Information Center http://public.imb.org/globalresearch/Pages/default.aspx
Lausanne International Researchers Network https://www.facebook.com/LausanneInternationalResearchersNetwork/
Minneapolis - St. Paul City View Reports: by John A. Mayer; religious demographics of the twin cities. http://cityvisiontc.org/?page_id=535
Movement of African National Initiatives (MANI): Continental Coordinator, Reuben Ezemadu; research focused on discovering unreached groups. http://maniafrica.com/research/
OC Research (Department of One Challenge International) http://www.ocresearch.info
Operation World, Patrick Johnstone; prayer oriented research on all countries (7th ed.) http://www.operationworld.org/
BOOKS & ARTICLES ON URBAN CHURCH & COMMUNITY RESEARCH
Conn, Harvie M., and Manuel Ortiz. Urban Ministry: The Kingdom, The City, and the People of God. Downers Grove, Ill.: InterVarsity Press, 2001. See also Section 1 in Planting and Growing Urban Churches: From Dream to Reality, edited by Harvie M. Conn. Grand Rapids, MI: Baker Books, 1997.
Conn, Harvie M. Urban Church Research: Methods and Models: Collected Readings. Philadelphia: Westminster Theological Seminary, 1985.
Dudley, Carl S. Community Ministry: New Challenges, Proven Steps to Faith Based Initiatives. Herndon, Virginia: Alban Institute, 2002. See especially part I.
Eisland, Nancy L. and R. Stephen Warner. “Ecology: Seeing the Congregation in Context.” In Studying Congregations: A New Handbook, edited by Nancy T. Ammerman, Jackson W. Carroll, Carl S. Dudley, and William McKinney. Nashville: Abingdon Press, 1998.
Hadaway, C. Kirk. “Learning from Urban Church Research.” Urban Mission, January 1985, 33-44.
Lingenfelter, Judith. “Getting to Know Your New City.” In Discipling the City: A Comprehensive Approach to Urban Mission, 2nd edition, edited by Roger S. Greenway. Grand Rapids, Mich.: Baker Books, 1992.
Monsma, Timothy M. “Research: Matching Goals and Methods to Advance the Gospel.” In Discipling the City: A Comprehensive Approach to Urban Mission, 2nd edition, edited by Roger S. Greenway. Grand Rapids, Mich.: Baker Books, 1992.
Nussbaum, Stan. Breakthrough: Prayerful, Productive Field Research in Your Place of Ministry. 2nd edition. Colorado Springs, Colorado: GMI Research Services, 2011. Website for GMI Research - http://www.gmi.org/about-us/
Sider, Ronald J., Philip N. Olson, and Heidi Rolland Unruh. Churches That Make a Difference: Reaching Your Community with Good News and Good Works. Grand Rapids, Mich.: Baker Books, 2002. See chapter 12.
Taylor, Dick. “Discovering Your Neighborhood’s Needs.” Sojourners, June 1979, 22-24.
BOOKS & ARTICLES ON GENERAL RESEARCH METHODS
Bergold, Jarg, and Stefan Thomas. “Participatory Research Methods: A Methodological Approach in Motion.” Forum: Qualitative Social Research 13, no. 1 (January 2012): Article 30. http://www.qualitative-research.net/index.php/fqs/article/view/1801/3334 Special issue on participatory qualitative research and action research.
Beukes, Anni. “Know Your City: Community: Profiling of Informal Settlements.” IIED Briefing: Policy and Planning, June 2014, http://pubs.iied.org/pdfs/17244IIED.pdf. Importance and methods of gathering data on informal urban communities to work for community improvements.
Chevalier, Jacques, and Daniel J. Buckles. Handbook for Participatory Action Research, Planning and Evaluation. Ottawa, Canada: SAS2 Dialogue, 2013. Accessed 7 Oct. 2016. http://www.sas2.net/sites/default/files/sites/all/files/manager/Toolkit_En_March7_2013-S.pdf
Creswell, John W. Qualitative Inquiry and Research Design: Choosing Among Five Approaches. 3nd edition. Thousand Oaks, Calif.: Sage Publications, 2013. A practical book covering narrative research, phenomenology, grounded theory, ethnography, and case study approaches.
Denscombe, Martyn. The Good Research Guide for Small-Scale Social Research Projects. 5th edition. New York: McGraw-Hill / Open University Press, 2014. Contains helpful checklists, summaries, and text boxes highlighting the essentials of basic research methods.
Denzin, Norman K., and Yvonna S. Lincoln, editors. Handbook of Qualitative Research, 4th ed. Thousand Oaks, Calif.: Sage Publications, 2011. A standard text on the subject containing contributions from many leading international scholars.
DeWalt, Kathleen M., and Billie R. DeWalt. Participant Observation: A Guide for Fieldworkers. 2nd edition. Lanham, Maryland: AltaMira Press, 2010.
Emerson, Robert M., Rachel I. Fretz, and Linda L. Shaw. Writing Ethnographic Fieldnotes. 2nd edition. Chicago: University of Chicago Press, 2011. Very specific and well-illustrated guidance on collecting and writing up ethnographic field observations.
Krueger, Richard R., and Mary Anne Casey. Focus Groups: A Practical Guide for Applied Research. 5th edition. Thousand Oaks, Calif.: Sage Publications, 2015.
Leedy, Paul D., and Jeanne Ellis Ormrod. Practical Research: Planning and Design. 11th edition. Upper Saddle River, N. J.: Pearson, 2015. This book has gone through many editions and is useful in many subject areas of research.
Mack, Natasha, Cynthia Woodsong, Kathleen M. MacQueen, Greg Guest, and Emily Namey. Qualitative Research Methods: A Data Collector’s Field Guide. Research Triangle Park, N.C.: Family Health International, 2005. Available free online at: https://www.fhi360.org/resource/qualitative-research-methods-data-collectors-field-guide. This resource is designed for use in international settings and developing countries.
Morgan, David L. Focus Groups as Qualitative Research. 2nd ed. Thousand Oaks, Calif.: Sage Publications, 1996. See also Morgan and R.A. Krueger, The Focus Group Kit (6 volumes also published by Sage).
Saldana, Johnny. The Coding Manual for Qualitative Researchers. 3rd edition. Thousand Oaks, Calif.: Sage Publications, 2016. Coding is an important process in analyzing qualitative research data, and this book gives detailed examples and a great variety of methods used in coding.
Taylor, Steven J., Robert Bogdan, and Marjorie L. DeVault. Introduction to Qualitative Research Methods: A Guidebook and Resource. 4th edition. Hoboken, N.J.: John Wiley & Sons, 2016. Contains extensive material on participant observation, in-depth interviewing, and working with qualitative data.
Weiss, Robert S. Learning from Strangers: The Art and Method of Qualitative Interview Studies. New York: The Free Press, 1994. Includes examples and excerpts from interview transcripts with comments.
Yin, Robert K. Case Study Research: Design and Methods. 5th edition. Thousand Oaks, Calif.: Sage Publications, 2014. A standard work on case study research.

Emmanuel Research Review
The Emmanuel Research Review (2004-2014) was a digital journal from the Emmanuel Gospel Center’s Applied Research department that featured articles, papers, resources, and information designed to be a resource for urban pastors, leaders and community members in their efforts to serve their communities effectively. Ninety-five issues of The Review were published during its ten-year run from 2004 to 2014. On this page we offer a list of all issues published, and links to those that have been reposted to this new site.
WHAT IS IT?

The Emmanuel Research Review (2004 - 2014) was a digital journal from the Emmanuel Gospel Center’s Applied Research department. The Review featured regular articles, papers, and other resources to support urban pastors, leaders and community members in their efforts to serve their communities effectively. Ninety-five issues of The Review were published during its ten-year run from 2004 to 2014.
THEN AND NOW
When EGC’s Applied Research and Consulting department began a comprehensive reorganization in 2014, we discontinued publication until we were in a better position to produce new materials that would be even more effective. In 2016, when we launched a new website, the ERR archive was no longer available. Now we are working to repost some of the best from the past while we continue producing new resources addressing a wide range of urban issues.

LIST OF PUBLISHED ISSUES
2014
Issue No. 95 — March 2014 — Knowing Your Neighborhood: An Update of Boston’s South End Churches. (EGC reassessed the status of churches in our own neighborhood, Boston’s South End.)
Issue No. 94 — December 2013 - January 2014 — Understanding Boston’s Quiet Revival. (Steve Daman, Senior Writer, EGC, offers questions and discussion that lead toward a working definition and overview of “the Quiet Revival.”)
2013
Issue No. 93 — October-November 2013 — Mapping A Systemic Understanding of Homelessness for Effective Church Engagement. (EGC’s Starlight Ministries shares a homelessness system map for Boston and suggestions as to how churches can more effectively engage and impact homelessness in their communities.)
Issue No. 92 — September 2013 — “Why Cities Matter” and “Reaching for the New Jerusalem,” Books by Boston Area Authors. (Reviews of: Why Cities Matter: To God, the Culture, and the Church, by Stephen T. Um & Justin Buzzard, and Reaching for the New Jerusalem: A Biblical and Theological Framework for the City, edited by Seong Hyun Park, Aída Besançon Spencer, & William David Spencer.)
Issue No. 91 — July-August 2013 — Grove Hall Neighborhood Study. (Story and statistics on many facets of life in one Boston neighborhood.)
Issue No. 90 — June 2013 — Hidden Treasures of the Kingdom Uncovered. Celebrating Ministries to the Nations: A Manual for Organizing and Planning an Event in Your City. (Rev. Dr. Gregg Detwiler, Director of Intercultural Ministries, EGC, and Dr. Bianca Duemling, Assistant Director of Intercultural Ministries, describe a ministry event and the journey they pursued to pull it together.)
Issue No. 89 — May 2013 — 2013 Emmanuel Applied Research Award: Student Recipients. (Excerpts from the award paper, “Cambridge City-Wide Church Collaborative Cooperates to Meet Community Needs,” by Megan Footit, and abstracts from the three runners-up.)
Issue No. 88 — April 2013 — Perspectives on Boston Church Statistics: Is Boston Really Only 2% Evangelical? (Rudy Mitchell, Senior Researcher, EGC, evaluates the sources, accuracy, limitations, and weakness of some commonly used church statistics, especially with regard to their application in Boston.)
Issue No. 87 — March 2013 — Christian Engagement with Muslims in the United States. (Rev. Dr. Gregg Detwiler, Director of Intercultural Ministries at EGC, hosts a video conversation on Christian Engagement with Muslims in the U.S. Panelists: Dave Kimball, Minister-at-Large for Christian–Muslim Relations, EGC; Nathan Elmore, Program Coordinator & Consultant for Christian-Muslim Relations, Peace Catalyst International; and Paul Biswas, Pastor, International Community Church – Boston.)
Issue No. 86 — February 2013 — The Vital Signs of a Living System Ministry. (Dr. Douglas A. Hall, President of EGC and author of The Cat and the Toaster: Living System Ministry in a Technological Age, shares how Living System Ministry principles serve as vital signs which can guide our understanding and practice of leadership in urban ministry.)
2012
Issue No. 85 — December 2012–January 2013 — “Toward A More Adequate Mission Speak” and Other Resources by Ralph Kee. (An introduction to five booklets by Boston-based church planter and animator of the Greater Boston Church Planting Collaborative, Rev. Ralph Kee.)
Issue No. 84 — November 2012 — The Boston Education Collaborative’s Partnership with Boston Public Schools. (History and highlights of recent collaboration between EGC’s Boston Education Collaborative and the Boston Public Schools Faith-Based Partnerships in building church-school partnerships; and details on the BEC’s “Reflection and Learning Sessions” that provide support for Christian leaders working with students.)
Issue No. 83 — October 2012 — Churches in Boston’s Neighborhood of Mattapan. (Erik Nordbye, Research Associate of EGC, studied and analyzed data on 65 Christian churches in Boston’s diverse Mattapan neighborhood.)
Issue No. 82 — September 2012 — Christian Churches in Somerville, Mass. (A profile of 46 Christian churches in the city of Somerville, Mass.)
Issue No. 81 — August 2012 — Christian Churches in North Dorchester of Boston, Mass. (Hanno van der Bijl, Research Associate at EGC, studied the diverse and vital expressions of the church in the North Dorchester neighborhood of Boston. The report also documents the slow growth in the number of churches over the last 25 years.)
Issue No. 80 — July 2012 — Developing Safe Environments for Learning and Transformation. (Rev. Dr. Gregg Detwiler, Director of Intercultural Ministries, EGC, shares from his experience regarding “a model for personal and organizational transformation” while underscoring the importance of creating a safe environment.)
Issue No. 79 — June 2012 — Emmanuel Applied Research Award: Student Recipients. (The 2012 award paper, “Miriam’s House Ministries and The Melville Park Micro-enterprise Experiment,” by Jim Hartman, is presented in its entirety, and there are links to the executive summaries of the three runners up.)
Issue No. 78 — May 2012 — The Rise of the Global South: The Decline of Western Christendom and the Rise of Majority World Christianity, by Elijah J. F. Kim. (An introduction to the above named book by Elijah J. F. Kim, former Director of the Vitality Project, EGC. Dr. Kim says “the center of gravity of the Christian faith has shifted from the West to the non-West.”)
Issue No. 77 — April 2012 — The Black Church and Hip Hop Culture & Under One Steeple, Books by Boston Area Authors. (Reviews of The Black Church and Hip Hop Culture: Toward Bridging the Generational Divide, edited by Emmett G. Price III, and Under One Steeple: Multiple Congregations Sharing More Than Just Space, by Lorraine Cleaves Anderson, former pastoral of International Community Church in Allston.)
Issue No. 76 — March 2012 — Hartford Survey Project: Understanding Service Needs and Opportunities. (Jessica Sanderson of Urban Alliance shares about the purpose, process, analysis, findings and application of the Hartford Survey.)
Issue No. 75 — February 2012 — Behind the Scenes: Setting the Stage for Conversation about the Church in New England. (Video series from Brandt Gillespie of PrayTV and Dr. Roberto Miranda of Congregación León de Judá in Boston about the church in New England.)
Issue No. 74 — January 2012 — Shared Worship Space, an Urban Challenge and a Kingdom Opportunity. (Dr. Bianca Duemling, Assistant Director, Intercultural Ministries, EGC, outlines the challenges of churches sharing space.)
2011
Issue No. 73 — December 2011 — Let’s Do It! Multiplying Churches in Boston Now. (Rev. Ralph A. Kee, animator of the Greater Boston Church Planting Collaborative, connects first century practices with 21st century potentialities for Boston.)
Issue No. 72 — November 2011 — Crossing Beyond the Organization Threshold. (Dr. Douglas A. Hall, President, EGC, shares thoughts on the limitations of organization and the danger of having it become our ministry’s focus, and how we can use organization and technology appropriately to benefit a living system.)
Issue No. 71 — October 2011 — Human Trafficking: The Abolitionist Network. (Sarah Durfey, director, the Abolitionist Network, an emerging ministry of EGC, talks about how we can address human trafficking using a Living System Ministry approach.)
Issue No. 70 — September 2011 — Urban Ministry Training in Metro Boston. (Hanno van der Bijl, Research Associate, EGC, offers a brief introduction on urban ministry training in Metro Boston, the Urban Ministry Training Directory, a brief analysis, and a list of related resources.)
Issue No. 69 — August 2011 — The Diverse Leadership Project. (Dr. Bianca Duemling, Assistant Director, Intercultural Ministries, EGC, gives a brief overview of the project which seeks to better understand leadership development, styles, and priorities within various ethnic church communities. Includes interviews with six New England church leaders in five different ethnic contexts.)
Issue No. 68 — July 2011 — Metro Boston Collegiate Ministry Project: Focus Group/Learning Team Report. (The story of how the collaborative project began, initial group assumptions, and the “hexagonning” exercise that engaged 50 local leaders in a shared learning process to understand local college ministry.)
Issue No. 67 — June 2011 — Metro Boston Collegiate Ministry Project: Student Enrollment Report. (Who attends Boston’s colleges? This report examines student enrollment profiles for each of the 35 schools in Metro Boston.)
Issue No. 66 — May 2011 — Emmanuel Applied Research Award: Student Recipients. (The 2011 award paper, “Faith-Based Healthcare for the Underserved of Lawrence, MA: A Pilot Project,” by Stephen Ko, is presented in its entirety.)
Issue No. 65 — April 2011 — Boston Education Collaborative Church Survey Report. (How Boston-area churches are engaged in education, what areas of programming they are interested in further developing, and what resources are needed for them to become more involved in education.)
Issue No. 64 — March 2011 — Connecting the Disconnected: A Survey of Youth and Young Adults in Grove Hall. (An April, 2010, report on out-of-work and out-of-school young adults ages 16-24 in the Grove Hall area of Boston, and an interview with Ra’Shaun Nalls and Martin Booth of Project R.I.G.H.T., who share the story behind the study.)
Issue No. 63 — February 2011 — Youth Violence Systems Project Special Edition Review. (An overview of the community-based process that is at the heart of the Youth Violence Systems Project (YVSP), the YVSP strategy lab, the reason why we haven’t solved the gang violence problem, and what we are learning.)
Issue No. 62 — January 2011 — The Urban Apostolic Task. (In this issue, Rev. Ralph Kee, animator, Greater Boston Church Planting Collaborative, illuminates the vision, practical instruction, and urgency of an apostolic ministry that engages the entire church in “new-world building movements.”)
2010
Issue No. 59 — September/October 2010 — A New Kind of Learning: Contextualized Theological Education Models. (Dr. Alvin Padilla, Dean of Gordon-Conwell Theological Seminary’s Center for Urban Ministerial Education, Boston, considers the challenge theological schools have best serving the needs of diverse cultures in cities today.)
2008
Issue No. 41 — September/October 2008 — Urban Youth Mentoring. (Rudy Mitchell, Senior Researcher, summarizes his research findings regarding various practical aspects on mentoring youth in an urban context. Rudy’s research draws from both secular and faith-based sources regarding preparation, planning, recruiting, screening, training, matching, support, monitoring, closure, and evaluation of youth mentoring programs.)
More to come!
This is just a start. Stay tuned for more back issues listed and posted on this site. Or check out the Wayback Machine link below for another way to find back issues.
Learn More / Take Action
Questions? Is there something missing from our archives that you need? If you have questions or comments about the Emmanuel Research Review, don’t hesitate to be in touch. We would love to hear from you!
Researchers may find additional back issues by searching the internet “Wayback Machine” here:
Perspectives on Boston Church Statistics: Is Greater Boston Really Only 2% Evangelical?
A frank look at the sources, accuracy, limitations, and weaknesses of some commonly used church statistics in Boston. As convenient and convincing as statistics are, they can be misunderstood, misapplied, and generate misinformation.

Resources for the urban pastor and community leader published by Emmanuel Gospel Center, Boston
Emmanuel Research Review reprint
Issue No. 88 — April 2013
Introduced by Brian Corcoran, Managing Editor, Emmanuel Research Review
What are the sources, accuracy, limitations, and weaknesses of some commonly used church statistics, especially with regard to their application in Boston? Wanting to encourage a more appropriate use of church statistics generally and in Boston, Rudy Mitchell, Senior Researcher at EGC, considers some of the more popular sources we encounter on the internet or in the news media, such as:
The U. S. Religious Census and the Association of Religious Data Archives
The Barna Research Group, and
Gallup Polls on Religion.
Rudy offers some quick and practical advice for those who are tempted to grab-and-go with the numbers, as if they were “gospel” to their next sermon, strategic planning meeting, church planting support fundraising website, or denominational report. As convenient and convincing as statistics are, beware! They also can be easily misunderstood, misapplied, and generate misinformation.
True or false?
“...only 2.1% of the people living in greater Boston attend evangelical churches.”
“Tragically, only 2.5% of the 5.8 million people in greater Boston attend an evangelical church.”
“Boston is...97.5% non-evangelical.”
“There are fewer than 12 Biblical, Gospel Centered, Soul-Winning Churches” among the “7.6 million people” in Greater Boston.
The twitter-speed circulation of misinformation about Greater Boston being only 2% evangelical contributes to an inaccurate portrayal of what God has been doing in Greater Boston for decades by failing to recognize the ministry of many existing evangelical churches. Furthermore, it misdirects the development of new ministries and leaders emerging and arriving in Boston each month.
The good news is that the local church research conducted by the Emmanuel Gospel Center in Boston over the last 40 years has identified a larger, more vital, and more ethnically diverse Church than suggested by recent and broader church research projects. With the benefit of a comprehensive database and directory of the churches in Boston, developed over decades, EGC has the opportunity to compare and contrast our street-by-street Boston results with broader, less dense, bird’s-eye-view national research. With all this info in hand, we can illustrate how Boston’s evangelical churches have been significantly underreported in national surveys and suggest that they might also be underreported in some other major U.S. cities. Go ye therefore and research your city.
Furthermore, given the longevity of our research, we have been able to identify what we call Boston’s “Quiet Revival,” which is characterized by growth in the number of churches and church attendees, increased collaborative ministry, and multiple interrelated prayer movements in Boston since 1965. Currently there are approximately 700 Christian churches in the three cities of Boston, Brookline and Cambridge in the heart of Metro Boston, and these churches include folks from many tongues, tribes, and nations.
God is and has been doing more in Boston than most national survey techniques can identify.
Perspectives on Boston Church Statistics: Is Greater Boston Really Only 2% Evangelical?
by Rudy Mitchell, Senior Researcher, Emmanuel Gospel Center
Infographics by Jonathan Parker
What about the U. S. Religious Census and the Association of Religious Data Archives (ARDA)?
The 2010 U.S. Religious Census was collected by the Association of Statisticians of American Religious Bodies (ASARB) and also presented by the Association of Religion Data Archives (ARDA). The 2010 U.S. Religious Census provides data by county and by metropolitan area. The method used by this census is basically to compile the numbers of churches and adherents, denomination by denomination. The Boston city data is a part of Suffolk County, which also includes the cities of Chelsea, Winthrop and Revere.

Through our research at Emmanuel Gospel Center, we have identified over 500 Christian churches within the city limits of Boston. The other three cities in Suffolk County have at least an additional 54 churches. Therefore, through first-hand research, we have counted at least 554 Christian churches in Suffolk County. The U.S. Religious Census counted only 377 Christian churches.1 Thus their count misses at least 177 churches. Because many new churches have been planted since our last count in 2010, we estimate that the U.S. Religious Census may have missed as many as 200 to 240 churches. In urban areas, the U.S. Religious Census / ARDA statistics are especially inaccurate because few African American, Hispanic, and other immigrant churches are counted, since many do not appear in the denomination lists used by the census. Other independent churches, some of which are very large, are often missed as well.
While the U.S. Religious Census perhaps needed to make some simple classifications of churches for the national compilations, these classifications are oversimplified and often misleading, especially at the local level. In urban areas there are many evangelical churches within denominations classified as “Mainline.” For example, in the city of Boston, the vast majority of American Baptist Churches (classified as Mainline) are evangelical. Other so-called “Mainline” denominations have some evangelical churches in Boston as well. Therefore, if one compiles the number of evangelical churches and adherents only from the list of churches classified as “Evangelical” by the U.S. Religious Census, one will end up with serious errors.
In addition, while the term “evangelical” is not typically used by African American churches, a majority of those churches would be considered “evangelical” in light of their beliefs and practices. This is also true of most Protestant Spanish-speaking and Haitian churches. In Suffolk County our research has identified at least 120 Spanish-speaking churches, and the vast majority of these are evangelical. Therefore, counts of evangelical churches and adherents must include these and additional immigrant evangelical church groups, if they are to be accurate.

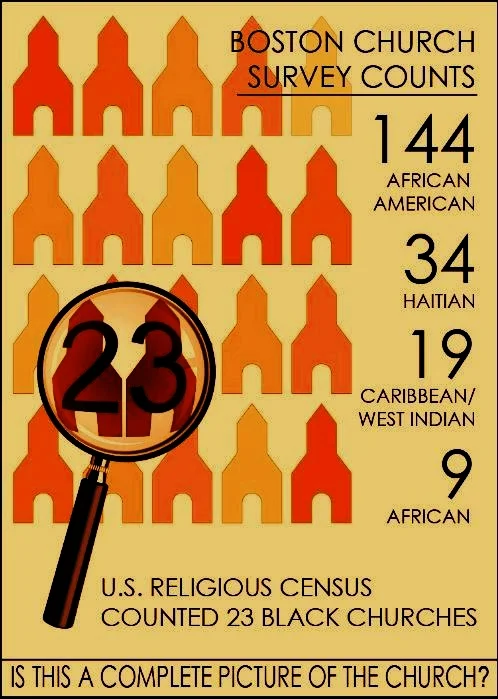
Likewise, in urban areas like the city of Boston, most Black Protestant churches are missed by the U.S. Religious Census. The commentary notes that this is the case. Although the census attempted to include the eight largest historically African American denominations, it fell far short of gathering accurate numbers for even these denominations. “Based on the reported membership sizes included in the address lists, less than 50% of any group’s churches or members were able to be identified… For the African Methodist Episcopal Church, they found approximately the correct number of congregations, though the membership figures are only about one-third of their official reports. For other groups, the church counts range from 11% to 50% of reported numbers, and membership figures are from 7% to 28% of the reported amounts.”2 In the case of Boston, one can see just how far off these numbers are. The Boston Church Directory research identifies 144 primarily African American churches, 19 Caribbean/West Indian churches, 9 African churches, and 34 Haitian churches in the city of Boston for a total of 206 Black churches. In contrast, the U.S. Religious Census identifies only 23 Black Protestant churches in all of Suffolk County. Thus the Census identifies (as Black Protestant) less than 11% of the Black churches that exist in the city. Given the size and importance of Black churches in urban areas, the U.S. Religious Census is completely inadequate in assessing religious participation in cities. Many of these churches belong to small denominations or are independent. While some Black churches are counted as part of evangelical and mainline denominations, they are not identified as Black churches.
At a time when hundreds of new evangelical churches have been planted in Boston and the greater Boston area, a number of church planters and media sources continue to lament the “cold, dark, sad and tragic” state of the Boston spiritual climate. While there is still a need for increased growth and vitality of many current churches, and a need for new church plants, these reports often give a one-sided and overly pessimistic view of the state of the Christian church in Boston. It is common to hear that only 2.1 or 2.5% of greater Boston residents are evangelicals. This number is passed on from source to source without question, often morphing and attaching itself to various subgroups of the population. This percentage underestimates and diminishes the work of God which is going on in greater Boston.
One can easily glean a sad harvest of bad news about Boston on the internet. For example, a web-posted Boston church planting prospectus says, “What most people do not consider is the spiritual brokenness that fractures the city. They fail to realize that the spiritual climate is incalculably colder than the lowest lows of a Boston winter…most remain blind to the spiritual darkness that pervades the city. Tragically, only 2.5% of the 5.8 million people in greater Boston attend an evangelical church. Not surprisingly, there are very few healthy evangelical churches…” Another church planter said, “According to one very thorough study, only 2.1% of the people living in greater Boston attend evangelical churches.” One church planter recalled God’s call, “God said, “I’m going to give you somewhere.’ I had no idea he was going to give me one of the hardest cities in the United States to go plant a church in…Boston is very intimidating. It’s 97.5% non-evangelical. For those non-math people, that’s 2.5 percent evangelical Christian. I didn’t even know there was a city like that before I started studying it.” While it may be more difficult to plant a new church in urban Boston than in suburban Texas or North Carolina, hundreds of successful churches have been planted in greater Boston in the last few decades.
In the city of Boston and surrounding towns, God has raised up new churches among many different groups of people. For example, in the city of Boston alone, more than 100 Spanish language churches have been planted. Many of these are not counted in typical “thorough” studies because they are either independent or do not belong to the denominations counted in these studies. In greater Boston there are even more Spanish speaking churches than in the city itself. Likewise the research often referenced does not count most of the Brazilian churches in greater Boston. The majority of the 420 Brazilian churches in eastern New England are located in Greater Boston. As many as 180 of these churches are nondenominational or directly affiliated with their denominations in Brazil, and therefore not counted in the ARDA data.3 Scores of African American, Haitian, African, Korean, Indonesian, and Chinese churches have also been planted in this area as well. Most, if not all of these immigrant churches would be considered evangelical. While some of these are small, quite a number of the churches have hundreds of active participants. Although one church planter claimed there was only one successful Anglo church plant, a little more research would have revealed that God has been growing many new and successful churches among this group, especially reaching Boston’s young adult population.
The source for some of the above statistics on greater Boston is based on the Association of Religion Data Archives information from 2000 which was also analyzed by the Church Planting Center at the Southern Baptist Theological Seminary.4 The Center’s report and PowerPoint presentation state that greater Boston is 2.5% evangelical.5 Since the ARDA data fails to include most of the Black Protestant, Hispanic, Haitian, Brazilian, and Asian churches under its evangelical category, it clearly underestimates the evangelical percentage. Even the slightly improved 2010 ARDA data only identifies 7,439 Black Protestants in Greater Boston.6 Just one black church (Jubilee Christian Church) of the city of Boston’s more than 200 black churches has about that number of members. In Greater Boston, there are many more black churches not counted in this study. If the city of Boston has about 100 largely uncounted evangelical Spanish-speaking churches, then Greater Boston (which includes Lawrence, Mass.) has at least double that number. This study also does not account for the many evangelical churches which in urban areas are affiliated with denominations classified by ARDA as “Mainline.” For example, more than 60 American Baptist churches in Greater Boston could be classified as evangelical rather than mainline. Numbers and percentages based on the ARDA data, therefore, fail to identify hundreds of evangelical churches in Greater Boston, and some of these are among the area’s largest churches.
What about the Barna Research Group?
The Barna Research Group has produced many reports on the beliefs and practices of Americans using phone surveys. By drawing on 42,000 interviews completed over the last five to ten years, they have compiled statistics which they have sliced up into 96 cities ("urban media markets”). The most recent of these Barna Reports are called Cities 2013. Barna also has produced parallel reports on 48 states.
The Cities 2013 report for the Boston area might give the impression to many people that it gives data primarily on the city of Boston or the city and its immediate suburbs. It is important to realize that this report covers an area extending from Nantucket to Laconia, New Hampshire, and eastern Vermont, as well as Worcester County, Massachusetts. The adult population of this media market area (DMA) in 2010 was 4,946,945 while the city of Boston’s adult population was 513,884 or only 10.4% of the total area.7 The total population of Barna’s “Boston” area was 6,322,433 compared to the total Boston city population of 617,594 (9.8% of the area). When using statistics from the Barna Cities 2013 report, one must keep in mind that the city of Boston is only a small part (~10%) of the area covered.
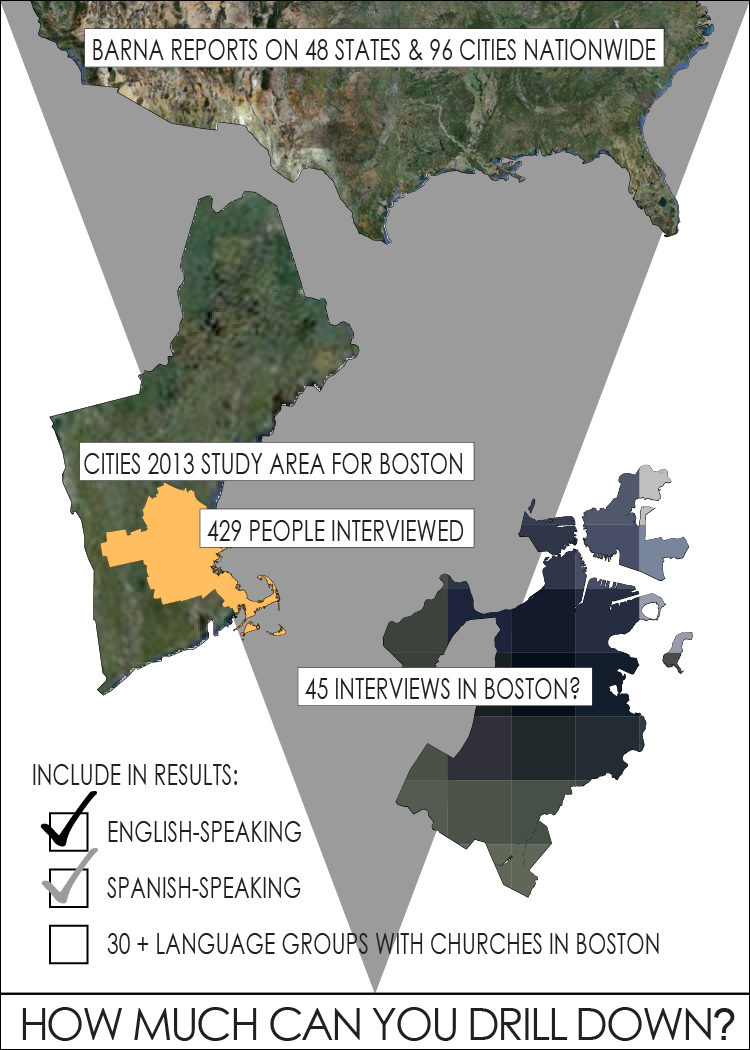
The Boston Cities 2013 Report is based on 429 interviews according to the Barna Research Group. Since the city of Boston represents 10.4% of the area’s adult population, one can estimate that about 45 interviews were done in Boston. Given the diversity of languages, racial groups, and nationalities in the city with its population of over a half-million adults, it is hard to imagine that this sample was large enough and representative enough to give a true picture of religious faith and practice in Boston. In addition, “while some interviews were conducted in Spanish, most were conducted in English. No interviewing was done in languages other than Spanish and English.”8 In fact, the Barna website says, “the vast majority of the interviews were completed in English.”9 Since the city of Boston has over 100,000 (17.5%) Hispanics10 with more than 100 churches, it is quite likely this group is underrepresented. This is just one of over 30 language groups which have churches in Boston. In the larger Barna study area (Boston DMA), there are 522,867 Hispanics and 344,157 Asians.11 The area also includes a very large Brazilian population with over 400 Brazilian churches and the fourth largest population of Haitian Americans with dozens of thriving Haitian churches. Because these language groups were significantly less likely to be included in the interviews, and because many of these groups are among the most active in Christian faith and practice, the Boston area report underestimates Christian beliefs and involvement in the area and especially if one equates its conclusions with the city of Boston.

Table of total populations of the City of Boston and the DMA media market area. (The Boston DMA area is the one used by the Barna Research group.)
What about the Gallup Polls on religion?
The Gallup organization interviews large numbers of adults every year on a variety of topics including religion. Recent reports have not only examined national trends, but have also analyzed how religious the various states and metropolitan areas are. During 2012, Gallup completed more than 348,000 telephone interviews with American adults aged 18 years and over.12 The Gallup organization uses what it calls the Gallup Religiousness Index when it states that one state or city is more religious than another. Specifically it is comparing the percentage of adults in the various states or cities who are classified as “very religious.” Two questions are used in the Gallup Religiousness Index:
(2) “How often do you attend church, synagogue or mosque? – at least once a week, almost every week, about once a month, seldom, never, don’t know, refused.”13
For someone to be classified as “very religious,” he or she would need to answer, “Yes, religion is an important part of my daily life,” and “I attend church, synagogue, or mosque at least once a week or almost every week.”
Nationally, 40% of American adults were found to be “very religious” on the basis of this standard. Significantly more Protestants (51%) were “very religious” than Catholics (43%).14 Religiousness generally increases with age, and so young adults are less religious than seniors.
The Gallup surveys have found that the New England states, including Massachusetts, have lower percentages of adults who are “very religious.” In fact, (1) Vermont (19%), (2) New Hampshire (23%), (3) Maine (24%), (4) Massachusetts (27%), and (5) Rhode Island (29%) are the five least religious states according to this measure.15 Several New England metropolitan areas also ranked low on the religiousness scale (Burlington, VT; Manchester-Nashua, NH; Portland, Maine). The Boston-Cambridge-Quincy metropolitan area ranked eighth least religious, with 25% of its metro area adults classified as “very religious.”16 Although many new churches have started in Boston and there is significant spiritual vitality in the city, two factors probably contribute to the low ranking. Boston has the largest percentage of young adults aged 20 to 34 years old of any major city in the country. This age group has lower percentages of “very religious” people than the older age groups. Also, Boston has a high percentage of Catholics (46.4%), and Catholics have a significantly lower percentage of “very religious” adherents.17 This factor also plays a role in the Massachusetts state ranking, since Massachusetts is now “the most heavily Catholic state in the union” (44.9%).18 One must keep in mind that the Gallup Religiousness Index is just one way of measuring how religious a person is, and it is based on self-reporting. The question about the importance of religion in one’s daily life can have many different meanings to different people. Other research has shown that the frequency of church attendance “does not predict or drive spiritual growth” for all groups of people.19
Some Quick Advice for Boston Church Statistic Users
From these examples, you can see that it is important to evaluate critically the religious statistics you read in the media. In some cases these statistics may be incomplete, inaccurate, or have large margins of error. In looking at the data for a city, you also need to understand the geographic area the report is studying. This could range from the named city’s official city limits, to its county, metropolitan statistical area, or even to a media area covering several surrounding states. In reading religious statistics and comparisons, you also need to carefully understand definitions and categories that the research uses. A study may categorize and count Black churches or Evangelical churches in ways that fail to count many of those churches. When a survey says one state is more religious than another, you need to understand how the study defines “religious.” Using religious research statistics without careful evaluation and study can lead to misinterpretation and spreading misinformation.
_______________
1 To accurately compare numbers, we compare only Christian churches from both our count and the U.S. Religious Census (which also included other religious groups such as Buddhists, etc.).
2 “Appendix C / African American Church Bodies,” 2010 U. S. Religion Census: Religious Congregations & Membership Study, 675, www.USReligionCensus.org (accessed 28 March 2013).
3 Cairo Marques and Josimar Salum, “The Church among Brazilians in New England,” in New England’s Book of Acts, edited by Rudy Mitchell and Brian Corcoran (Boston: Emmanuel Gospel Center, 2007), II:15. See link here.
4 J. D. Payne, Renee Emerson, and Matthew Pierce, “From 35,000 to 15,000 Feet: Evangelicals in the United States and Canada,” Church Planting Center, Southern Baptist Theological Center, 2010.
5 Ibid.
6 Association of Religion Data Archives, “Boston-Cambridge-Newton, MA, NH Metropolitan Statistical Area: Religious Traditions 2010,” www.thearda.com (accessed 5 May 2013).
7 U.S. Census 2010, Summary File 1, Table DP1 (Population 18 and over). The Barna interviews were only with adults.
8 Pam Jacob, “Barna Research Group,” Email. 2 April 2013.
9 Barna Research Group, “Survey Methodology: The Research Behind Cities,” Barna: Cities. Barna Cities & States Reports (accessed 8 April 2013).
10 U.S. Census 2010, Summary File 1, Table DP1.
11 U. S. Census 2010, Summary File 1, Table DP1.
12Frank Newport, “Mississippi Maintains Hold as Most Religious U.S. State,” Gallup, 13 Feb. 2013 www.gallup.com (accessed 24 April 2013).
13 Ibid.
14 Ibid.
15 Ibid.
16 Ibid.
17 Catholic Hierarchy website, Boston Archdiocese, 2006, www.catholic-hierarchy.org/diocese/dbost (accessed 24 April 2013).
18 “Massachusetts Now Most Catholic State,” Pilot Catholic News, 11 May 2012, www.PilotCatholicNews.com (accessed 24 April 2012)
19 Greg L. Hawkins and Cally Parkinson, Move: What 1,000 Churches Reveal About Spiritual Growth (Grand Rapids, Mich.: Zondervan, 2011), 18-19.


![Ethiopian Churches in Greater Boston [map]](https://images.squarespace-cdn.com/content/v1/57ff1c7ae58c62d6f84ba841/1506113852983-TSLLC1FENTJJGZYIO7MM/orthodox+cross+church.jpeg)


Keywords
- #ChurchToo
- 365 Campaign
- ARC Highlights
- ARC Services
- AbNet
- Abolition Network
- Action Guides
- Administration
- Adoption
- Aggressive Procedures
- Andrew Tsou
- Annual Report
- Anti-Gun
- Anti-racism education
- Applied Research
- Applied Research and Consulting
- Ayn DuVoisin
- Balance
- Battered Women
- Berlin
- Bianca Duemling
- Bias
- Biblical Leadership
- Biblical leadership
- Black Church
- Black Church Vitality Project
- Book Recommendations
- Book Reviews
- Book reviews
- Books
- Boston
- Boston 2030
- Boston Church Directory
- Boston Churches
- Boston Education Collaborative
- Boston General
- Boston Globe
- Boston History
- Boston Islamic Center
- Boston Neighborhoods
- Boston Public Schools
- Boston-Berlin
- Brainstorming
- Brazil
- Brazilian
- COVID-19
- CUME
- Cambodian
- Cambodian Church
- Cambridge


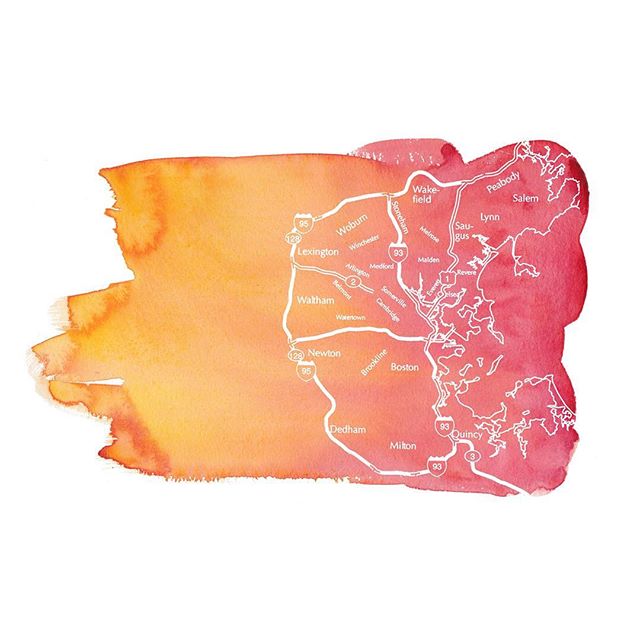


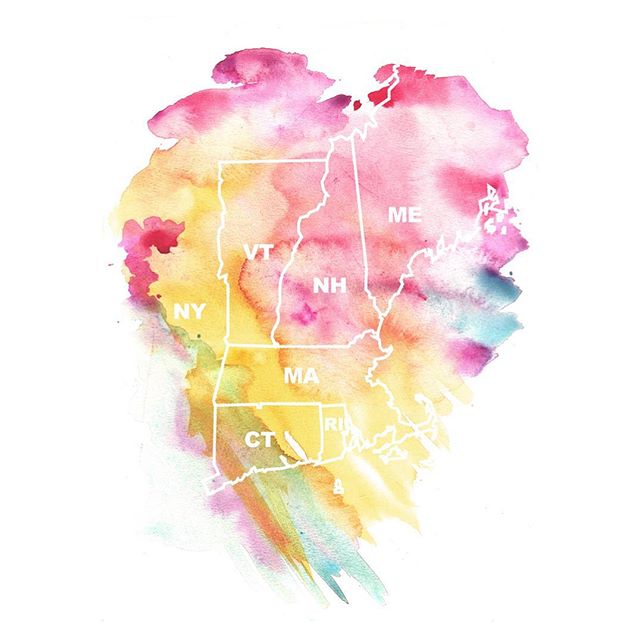
A frank look at the sources, accuracy, limitations, and weaknesses of some commonly used church statistics in Boston. As convenient and convincing as statistics are, they can be misunderstood, misapplied, and generate misinformation.